In this post, we’ll take you through a few important tools and concepts that help us at Mercy For Animals and that we think can also help you be a better advocate for farmed animals.
First we’ll talk about A/B testing and how you can use tools like Optimizely and Google Optimize to get more donations, sign-ups, downloads, and more.
Next we’ll briefly discuss monitoring your data, which is an important (and often neglected) step.
Then we’ll discuss how we used the powerful scripting language Python to pull and structure data from Optimizely and how you can use Python’s rich set of modules to accomplish all kinds of tasks.
Finally we’ll talk about the power of open source and how important it is to share tools and knowledge with others so that everyone in the movement benefits.
(If you just want the final code for the program we built, here’s the link: https://github.com/uvaaland/optimizely.)
A/B Testing
At MFA we use our websites (we have several) for many different important program areas.
We use them as ways for people to donate to our work, as donor support is the only reason we can continue advocating for animals worldwide. We use them to provide information on the issues and help people get involved or change their diets. And, we get information to millions of people through our blogs and help the message get out into the world through the items in our merch store.
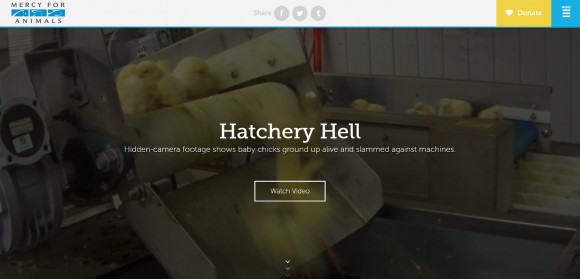
When it comes to designing all the different pages of our websites though, we could approach it in an infinite number of ways. If we have a handful of great ideas for how to design our donation page, which of those designs will connect with people the most and bring in the most donations? Which image should we use on our volunteer page to inspire people to get involved?
This is where A/B testing comes in.
A/B testing (or “split testing) is an experiment used to determine which of several options performs the best. If you have four different web page designs, you can run an A/B test with all four and see which one yields the best outcomes. Then you can use the winner of the test for your actual page going forward and continue running tests with other ideas, continually trying to get the best-performing page you possibly can.
You could start with a web page where only 1 percent of people make a donation and slowly improve it to the point where 10 percent of people do. A/B testing can help you do that, and in the end that means helping more animals.
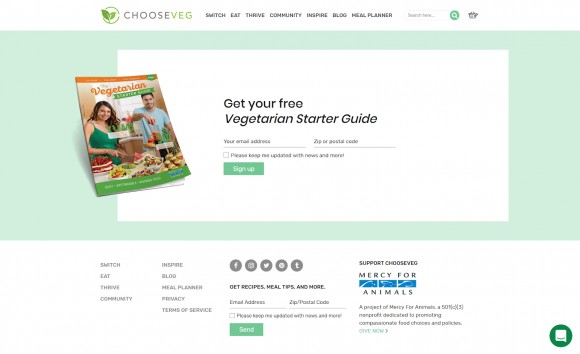
At MFA, we use the software tool Optimizely to run A/B tests on as many pages as we can, constantly improving our outcomes. (Google Optimize is a free A/B testing tool that we haven’t tried.) In addition to donations, an outcome we try to optimize is email submissions: new subscribers to our newsletter, The Voice; sign-ups for our Vegetarian Starter Guide (VSG) program; new volunteers for our Hen Heroes program, etc.
When gathering data as part of A/B testing, make sure to provide users with all legally required information about how their data will be stored and used. This can be done in a privacy policy.
Monitoring Your Data
MFA has an analytics and research volunteer program called Analytics For Animals (AFA) that connects analytically minded people with opportunities to use their skills for animal advocacy.
(If you want to get involved with AFA or know someone who does, send an email to [email protected] and we’ll get you plugged in.)
For this project, Uno Vaaland (an AFA volunteer since 2017) wrote a script in the language Python that allows us to pull all our data from Optimizely and monitor it over time. This is incredibly valuable because we can use this data to track our conversion rates for various web pages and answer questions like which types of A/B tests result in the highest conversion rate boost?
When people land on our VSG program sign-up page, for example, what percentage of them actually sign up? Has that percentage increased over time? (This is what we would hope, since we’re continually conducting tests and trying to boost the sign-up rate.) Which A/B tests increased sign-ups the most?
Google Analytics also has a lot of valuable data that we monitor on an ongoing basis.
As the saying goes, “What gets measured gets managed. If we want to have an impact for animals, we should measure and monitor the important things.
When gathering data that you plan to monitor, make sure to provide users with all legally required information about how their data will be stored and used. This can be done in a privacy policy.
Pulling Optimizely Data With Python
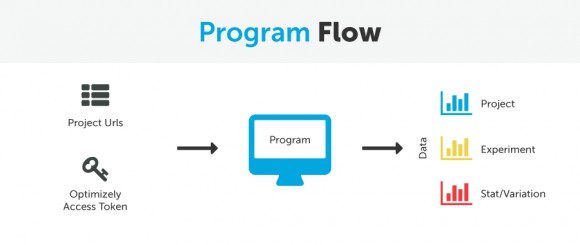
To effectively monitor the data, we need to write a program that interacts with the Optimizely API and allows us to pull data from it in an automated and convenient fashion. We want the program, given a list of project URLs and the corresponding Optimizely access token, to pull all project data: the experiments, variations, and stats associated with each project.
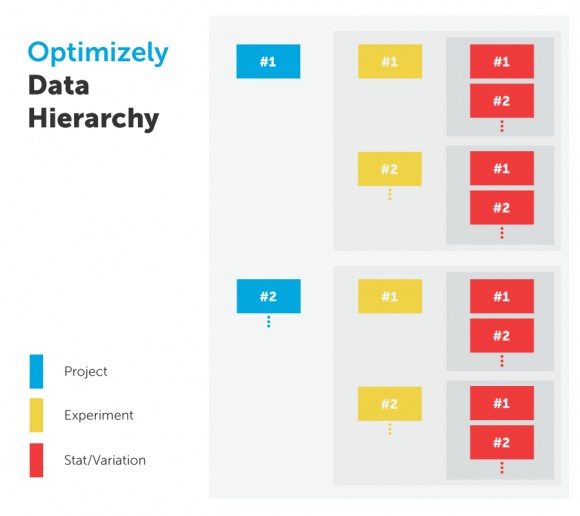
(A quick note on terminology: “Experiments are individual tests, such as trying to increase donations by using different pictures on the donation page. “Variations are the different versions of the page you’re trying—in this example, the different images. Finally, “stats refers to the results data—how many people visited the different pages, what percentage of them took various goal actions, etc. Which stats to collect is a decision made when the experiment is created.)
The data we want to pull from Optimizely is organized in a hierarchy as shown in the figure below. Highest up sit the projects. For each project there can be several experiments, which in turn can have multiple stats and variations. Each variation, stat, experiment, and project is associated with a URL, and we need to make requests to each of these URLs in order to pull all the data.
The task is essentially this:
- Take in a list of project URLs.
- Make a request for each URL to pull the data and also pull the additional URLs for the experiments, variations, and stats.
- Combine and store the received data.
- Repeat with all additional URLs.
The only other input that the user needs to provide in addition to the list of project URLs is an Optimizely access token.
The program flow is illustrated in the figure below. The program takes in the list of project URLs and the access token and outputs the data in CSV files for all projects and their associated experiments, stats, and variations.
The program was written using the Python programming language. Python is a versatile scripting language with a huge collection of powerful modules for solving all kinds of tasks. It is also free to use, enjoys a worldwide user base, and is considered by StackOverflow to be the “fastest-growing major programming language. (source)
The initial version of the program was based largely on the requests and pandas modules in Python: requests for making all the necessary HTTP requests and pandas for collecting and organizing the data. Although this version of the program did the job correctly, the performance was poor and needed some improving.
Making requests in serial, or one after the other, is not efficient. To improve the performance of the program, we made use of some of the asynchronous capabilities that have recently been added to Python. The asyncio and aiohttp modules allow requests to be made in an asynchronous fashion that greatly improves performance.
In our test case, making a total of 1,202 requests, the execution time came down from about 20 minutes for the first version of the program to about 1 minute for the improved version. These numbers will vary from case to case and user to user, but the asynchronous version of the program will in any case perform at least as well as the serial version.
To make it easy for other users to install and run the program, we have collected all the necessary Python libraries in a conda environment with step-by-step instructions on how to set it up. This makes it easier for users to get started without the hassle of finding and installing all the project dependencies.
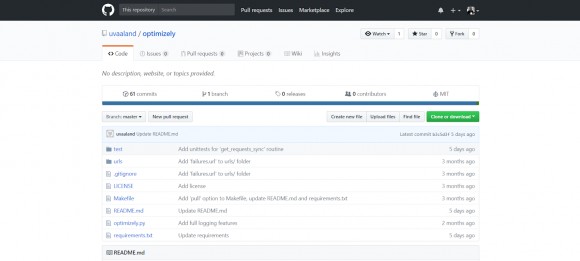
The project is hosted on GitHub and is free for anyone to download and use. You can use this project repository to get the program set up and get started pulling your own data from Optimizely.
GitHub project link: https://github.com/uvaaland/optimizely
Note: If you want to start learning Python, Learn Python the Hard Way is highly recommended.
The Importance of Open Source
In working on this project, we made extensive use of programs and tools that others have developed and made available free of charge. These include all the Python modules and even the Python programing language itself. Without these tools, we would have had to write much more code ourselves, which would have made the project incredibly demanding and probably infeasible.
Sharing tools is a great way to help one another by making sure that we don’t need to start from scratch every time we sit down with a new project. Having optimized tools such as the requests and pandas modules for completing common tasks means that you can focus your energy on designing and building more specialized features of your projects.
Hosting a code on a git-based web service, such as GitHub, is a great way to make it available for others to use. Others using Optimizely who are interested in conveniently accessing their project data can download the code and start using it right away.
We hope that other advocacy groups will find these tools useful. By sharing tools and information, we help one another and increase our impact.
Resources
Here are some additional resources that you might find helpful. (Some of these were also included in the post as links.)
- Learn Python the Hard Way – Great resource for learning practical Python
- Optimizely – A/B testing software that we use at MFA
- Google Optimize – Free A/B testing software
- GitHub – Place to find and host open source code
Also, if you want to use your analytics and research skills for animal advocacy, consider volunteering for our Analytics For Animals volunteer program. Send an email to [email protected], and we’ll pick up the conversation from there!
Credits
All code was written by Uno Vaaland. This post was co-written by Steven Rouk and Uno Vaaland.
Uno Vaaland, Analytics For Animals Volunteer. [email protected]
Steven Rouk, Data Analyst and Researcher at Mercy For Animals. [email protected]
…
If you want to hear about our research blog posts as they’re published, see here for instructions on how to do so: How to Subscribe to the MFA Research Blog.
To read more of our research blogs, click here: MFA Research Blog.